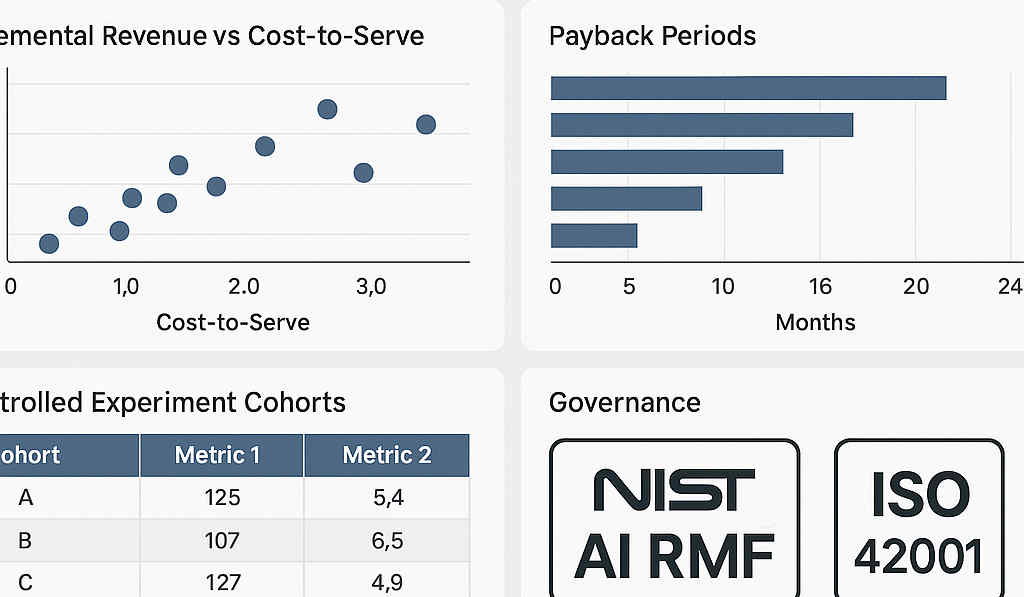

Every insurance AI initiative eventually meets the same moment: the CFO, or the audit committee, asks how do we know this is working? Too often the answer is a vendor’s benchmark, a pilot team’s enthusiasm, or a chart showing activity rather than outcome.
That answer won’t survive budget season. And as AI moves from experiments into core claims and underwriting workflows, the measurement bar rises. Leaders need ROI numbers that hold up to the same scrutiny as a reserve analysis: clear baselines, controlled comparisons, stated assumptions, and a record of what changed.
This is a practical method for getting there.
Why most AI ROI claims don’t hold up
The common failure patterns are worth naming, because each one has a fix.
- No baseline. The team didn’t measure the process before AI arrived, so any improvement is an estimate.
- Selection bias. The pilot ran on the easiest claims or cleanest submissions, then results were extrapolated to the whole book.
- Activity metrics. “Documents processed” and “model accuracy” are reported instead of cycle time, cost, leakage, or bind ratio.
- Unrealized savings. Hours saved are counted as cost reduction, even though nobody’s workload or headcount plan actually changed.
- Hidden costs. Licensing is counted, but integration, human review time, monitoring, and model maintenance aren’t.
A finance-grade method addresses each of these explicitly.
Step 1: Define the decision and the outcome
Start with the business decision AI changes, not the technology. For each use case, write a one-page brief:
- Workflow and decision: e.g., “routing property FNOLs to fast-track or complex queues.”
- Primary outcome KPI: e.g., cycle time to first payment for fast-track-eligible claims.
- Secondary KPIs: loss adjustment expense per claim, reopen rate, customer complaints.
- Guardrail metrics: indicators that must not worsen — leakage, QA error rate, regulatory complaints.
- Risk tier: which determines how much testing and human oversight is required.
Guardrail metrics are what separate credible ROI from wishful thinking. A faster claims process that increases leakage isn’t a win.
Step 2: Establish a clean baseline
Measure the current process for at least one full cycle before deployment — ideally a quarter, so you capture volume and mix variation. Record:
- Volume by segment
- Handling time (touch time) and elapsed time (cycle time)
- Quality measures from QA sampling
- Financial outcomes: LAE, leakage estimates, premium bound
If historical data is unreliable, run a short time-and-motion study on a representative sample. It’s far cheaper than arguing about baselines later.
Step 3: Use a comparison group
The strongest evidence comes from comparing like with like at the same time.
Randomized assignment
Where possible, randomly assign incoming work — claims, submissions, service requests — to either the AI-assisted process or the existing process. Randomization neutralizes seasonality, mix changes, and team differences.
Matched cohorts
When randomization isn’t operationally feasible, compare AI-assisted work against a matched group: same line, same severity band, same region, same time period.
Staggered rollout
Rolling out to teams or regions in waves creates natural comparison groups. Differences between teams that have AI and teams that don’t yet have it, over the same period, give you a defensible estimate of effect.
Illustrative example: a carrier deploying submission intake AI might enable it for two of four regional underwriting teams in the first quarter. If the enabled teams’ quote turnaround improves while the others stay flat, and mix is comparable, the difference is attributable with reasonable confidence.
Step 4: Count all the costs
Total cost of ownership should include:
- Software and infrastructure, including inference costs at production volume
- Integration and data engineering effort
- Human review and exception handling time — the people checking AI outputs
- Model monitoring, retraining, and governance overhead
- Change management and training
Human review time is the most commonly forgotten cost, and it’s often significant in early phases. Measure it directly.
Step 5: Convert operational gains to financial value — honestly
Translate KPI movements into money using conservative, stated assumptions.
- Capacity gains: hours saved × loaded cost × a realization rate. Be explicit: are those hours avoiding new hires, reducing overtime or contractor spend, or being redeployed to higher-value work? Redeployed capacity is valuable, but it should be reported differently from hard savings.
- Revenue effects: for underwriting, incremental bound premium × margin, attributed through the comparison group.
- Loss and expense effects: for claims, reductions in LAE, leakage, or litigation rates — again measured against the comparison group.
Present hard savings, capacity value, and revenue contribution as separate lines. Finance teams trust a business case more when it doesn’t blend them together.
Step 6: Report value and risk together
AI ROI isn’t only a financial question. Boards increasingly expect evidence that value is being delivered within acceptable risk. Each quarterly report should combine:
Value
- Outcome KPIs against baseline and comparison group
- Realized savings, capacity redeployed, revenue contribution
- Payback period, updated with actuals
Reliability
- System availability and latency against targets
- Exception and handoff rates
- Human review hours
Risk and governance
- Override rates and their reasons
- QA findings on AI-assisted work
- Complaints or regulatory inquiries involving AI-assisted decisions
- Material model or rule changes made in the period
Anchoring this reporting to a recognized framework, such as the NIST AI Risk Management Framework or ISO/IEC 42001, gives directors a consistent vocabulary across use cases.
Step 7: Decide with the evidence
The purpose of measurement is to make decisions: scale what works, fix what wobbles, and stop what doesn’t. Set the decision criteria in advance — for example, “expand to all regions if cycle time improves by at least X with no deterioration in QA error rate.” Pre-committing to criteria prevents both premature scaling and pilots that never end.
The payoff of doing it properly
A finance-grade ROI method takes more discipline up front. But it pays back in three ways. Budget conversations get shorter because the evidence is already there. Governance reviews get easier because risk metrics are reported alongside value. And the organization learns faster, because it can tell the difference between AI that’s working and AI that’s merely busy.
Put governance and ROI measurement on one page. Download the Aketud AI Governance Checklist for the controls, metrics, and reporting structure insurers use to prove AI value and manage AI risk together.